When I first joined Hiring Hub in May 2019, there had been early talks of moving the app from a monolith to Rails API. Now a year down the line and our architecture is starting to take that shape, with a number of features that have been built taking advantage of a decoupled React front-end and Rails API back-end.
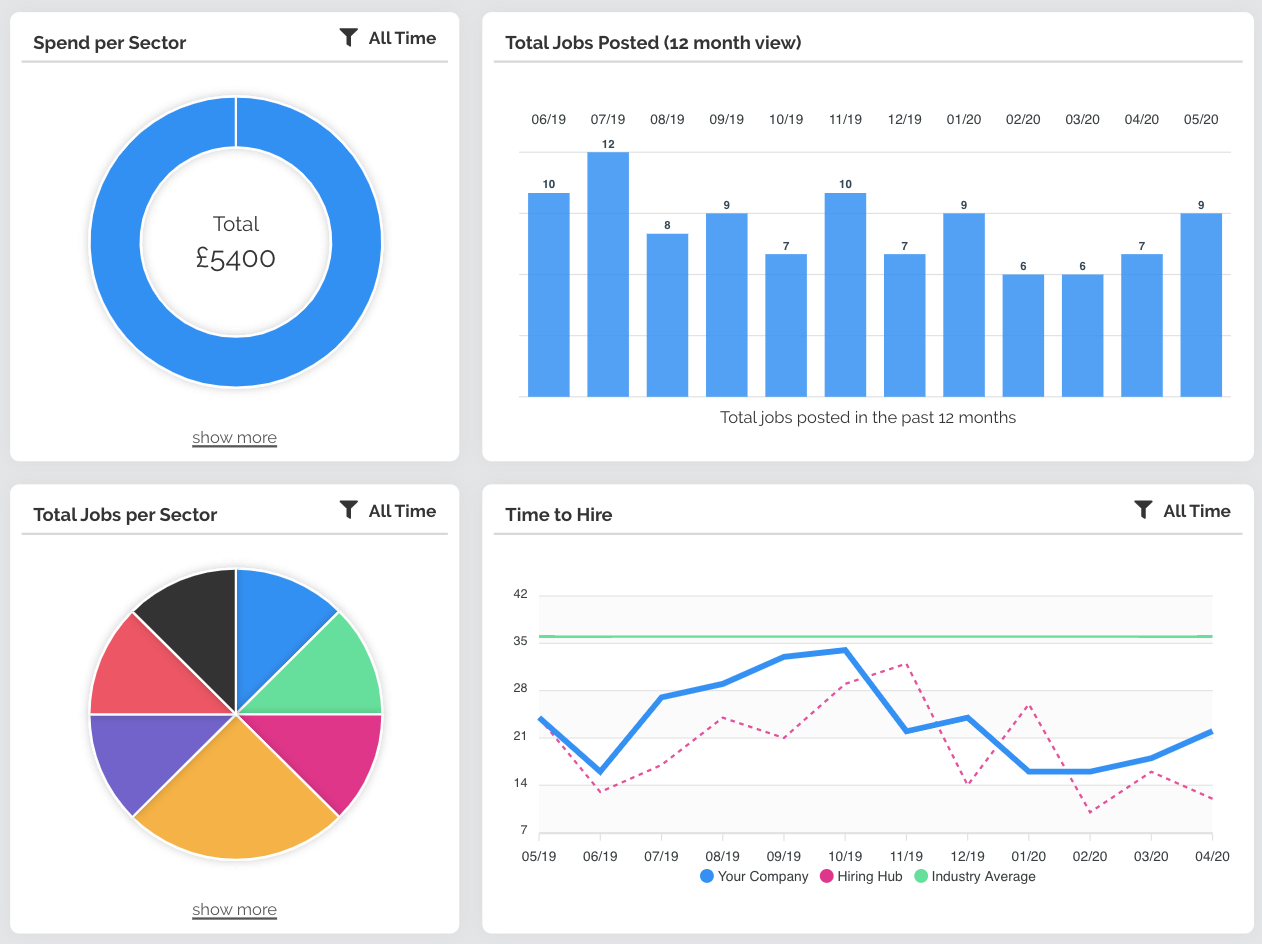
One of these features being an analytics dashboard that we built for employers, which we released last month in April. This feature aims to allow employers to track a wide range of metrics including average time-to-hire per month, total money spent per sector, total jobs per sector and more. The dashboard was built with a Rails API back-end, using the Graphiti gem and Spraypaint client library.
Graphiti is essentially taking everything great about GraphQL and building it on top of REST in a positive-sum approach, utilising advantages from both and packaging them into one place. Graphiti provides us the ability to build graph APIs with conventions and patterns to follow, leading to increased productivity and consistency.
How we used Graphiti to provide data for the client
Using Graphiti to create our APIs meant we were able to read graphs of data. Since we needed to query multiple API endpoints (employers, jobs, applications etc) this fit in perfectly, allowing us to load data effectively with minimal API requests.
In order to be able to build a graph of data and expose our ActiveRecord models to the API, we had to build resources from them, which are abstractions around API endpoints, giving us an interface around query and persistence operations. Following this we defined relationships on those resources which connect one resource to another. Once the relationships were made, we were then able to side-load resources (load multiple resources in a single request) in order to have all the data we needed in one go. Due to cutting down on the number of API calls we had to make, the time taken to load data had reduced, leading to improved performance on the page.
One of the many resources we built and used for this feature was the Job resource to query job related data, which is needed for for each widget on the dashboard. This resource consists of Attributes and Types which correspond to JSON keys and values, as well as Statistics, Filters and a Base Scope, giving us a tonne of out of the box behaviour to make use of.
One great feature of Graphiti is to allow us to limit behaviour of these attributes, for example, making use of the :readable and :writeable flags which give us the ability to limit privileges for users to only read certain data, or write data only if they meet conditions set in custom methods. Another way to limit the data users can see is using Graphiti’s base_scope method, which can be overridden to apply logic to every query and is a staple in each resource we define. For the example of the analytics dashboard, we return only data that belongs to a specific employer, and using a base_scope made this simple.
The use of statistics was one of my favourites when building the Job resource. Statistics are useful because they allowed us to aggregate data in multiple ways, such as creating a total count of all Jobs that an employer has posted on the system, used on the pipeline (funnel) widget. Or creating an average number of jobs posted in a month, used on the bar chart widget.
Enter Spraypaint
Once we had everything set in place in the back-end, we made use of Spraypaint, Graphiti’s associated client library, to make the API calls to fetch data to pass to our React front end. Using Spraypaint gave us the ability to avoid typing low level query language when querying the database and instead simplified this process, allowing us to easily compose queries.
Graphiti allows us to define these resources that do so much, yet look so simple. By leveraging conventions we are able to remove boilerplate and be left with just the parts that we care about.
What is Hiring Hub?


